Bret Scher, MD - Figure 48
Carbohydrate Restriction-Induced Elevations in LDL-Cholesterol and Atherosclerosis: The KETO Trial.
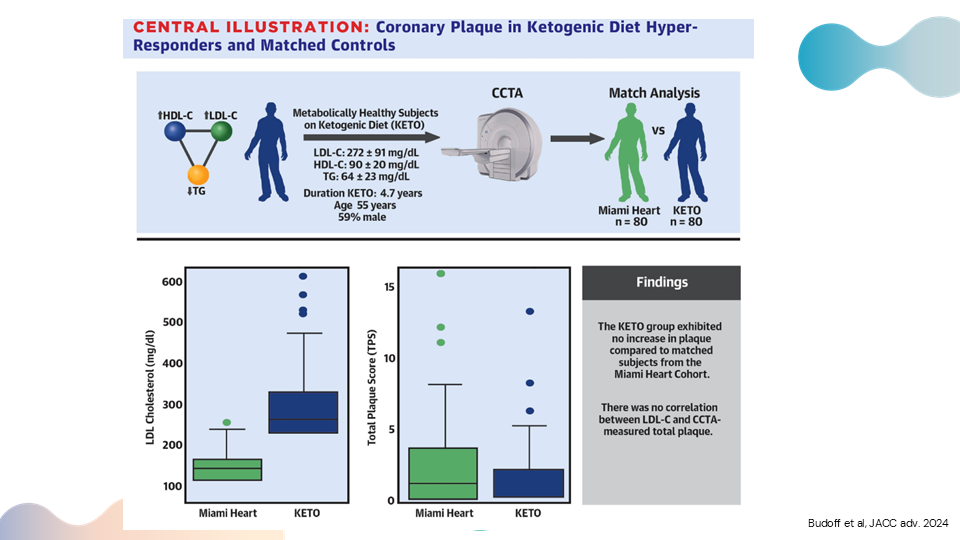
Here's the setup of this study. You can see this triangle with high HDL, high LDL, and low triglycerides – the so-called triad that makes up the lean mass hyper-responder phenotype, metabolically healthy subjects on a ketogenic diet. You can see the average LDL was 272 mg/dl, though some individuals saw LDLs of 500-600. But the average LDL was 272, with an average HDL of 90, and average triglycerides of 64. They had been on a ketogenic diet for almost five years with a mean age of 55. So, this is a pretty good cohort of people who have had high cholesterol – very high cholesterol – for about five years. They did a coronary CT angiogram – not a calcium score, though they did do a calcium score – which is a much more sensitive marker to look for coronary plaque. Then they were able to get a subset of patients from what's called the Miami Heart Study. These patients were relatively metabolically healthy as well, with a much lower LDL-cholesterol average of 120. And they also had coronary CT angiograms. So, you could compare the CT angiograms from the lean mass hyper-responder group with markedly elevated LDL, to those of the Miami Heart group with normal LDL. You can see in these bar graphs below, the difference in the LDL cholesterol, with the green being the Miami Heart and the darker blue being the KETO – dramatically different levels of LDL cholesterol. Then, the next graph shows their total plaque score. Again, this is a much more sensitive marker than the coronary calcium score. You can detect a much earlier stage of atherosclerosis using the coronary CT angiogram and the plaque score. Essentially, there was no difference between the plaque scores of those in the Miami Heart study with lower LDL-cholesterol, and the lean mass hyper-responders with markedly elevated LDL-cholesterol.